
What is it all about?
Datadog was built for any organization that runs servers, databases, applications, and tools. It is used by companies of all sizes, from startups to some of the largest enterprises in the world, in an array of industries. A few of Datadog’s best-known clients are Airbnb, Spotify, HP Cloud Services, EA, and Salesforce.
With 120+ turn-key integrations (including AWS, Docker, Chef, and PagerDuty), Datadog seamlessly aggregates metrics and events across the full DevOps stack.
Typically used for:
Video & screenshots
screenshots
Who is it for?
Freelancers
Startups
Agencies
SMBs
Enterprises
Key Features
- 120+ turn-key integrations for data aggregation - Clean graphs of StatsD and other integrations - Slice and dice graphs and alerts by tags, roles, and more - Easy-to-use search for hosts, metrics, and tags - Alert notifications via e-mail and PagerDuty -Full API access - Overlay metrics and events across disparate sources - Out-of-the-box and customizable monitoring dashboards - Easy way to compute rates, ratios, averages, or integrals - Sampling intervals of 10 seconds - Mute all alerts with 1 click during upgrades and maintenance - Tools for team collaboration
Benefits
- Correlate metrics from all your apps, tools, cloud providers, and cloud services including Amazon EC2, web servers, StatsD, SQL, and NoSQL databases - Easily graph, alert, and analyze your mass of data with real-time dashboards in seconds, not minutes - Rank and filter performance metrics so you can focus on those that matter - Get alerted only on critical issues using any metric, for a single host or for an entire cluster - Zero in on the right code changes, relevant config updates, or scheduled jobs - Support team collaboration with change and comment annotations in-context of your production data - No-hassle monthly pricing - no long-term commitments, just pay by the month
Advertisement
Pricing
Yearly
Monthly
Lifetime
Free
Freemium
Trial With Card
Trial No Card
By Quote
Description
Free up to 5 hosts
$15/host/month for up to 500 hosts
Custom pricing for 500+ hosts
http://go.datadoghq.com/pricing-page
Integrates With
Amazon
Github
Microsoft Azure
Docker
Chef
golang
MongoDB
Puppet


Product Analysis


As today's IT infrastructures become larger and more complex, monitoring them becomes ever more difficult. Whether your system is on your premises, or living in the cloud, processing and understanding the hundreds or thousands of metrics and events it generates is a major chore. Multiply this by all the servers and hosts and services in your entire infrastructure and you get something too big to manage without serious help.
Datadog provides that help. It gathers and displays all the data from across your entire infrastructure using easy to understand dashboards. You can configure the right alerts for your infrastructure's unique needs. Monitor the data using real-time graphs with overlays, or combine different metrics in one display to look at the relationships between them.
See something interesting, suspicious, or downright scary? Annotate it and start a discussion with the rest of the team right from the dashboard. You can conduct the discussion within Datadog or push it out to your favorite collaboration tool. The system can also provide you with important contextual information about what was going on when the issue occurred. Built-in runbooks give you a place to log information about alerts, along with the next steps for troubleshooting.
In short, Datadog is a cloud-scale monitoring solution designed to help you monitor even the largest infrastructures.
In this review we'll take a run through the features and capabilities of Datadog. The goal is to help you decide if they are the solution to your monitoring needs. We begin with the key features the Datadog team stresses.
Features
Datadog offers a set of features that are as big as the job they do for you. We'll take a quick look at each of these features here, and go into greater depth when necessary in the rest of this review. The main features of this service are:
- Integrations. This kind of monitoring product is of little use if it doesn't integrate with the tools and services you want to monitor. Datadog gives you more than 120 turn-key integrations, covering SaaS and Cloud providers, automation tools, bug trackers, databases, and more.
- Dashboards. Build powerful dashboards to view, graph, and manage everything you are monitoring. You can customize views either in the code or interactively and get real-time data and graphs.
- Correlation. Thanks to its full-text structured search capabilities, Datadog helps you quickly correlate monitored issues with actions taken on the system so you can quickly find the cause.
- Collaboration. Get visibility across teams to resolve issues faster. Discuss issues, annotate changes, create runbooks, and track who dealt with an issue before.
- Metric Alerts. Get alerts that are full of relevant information instead of confusing, one-line error messages. Configure Datadog to send the alerts you want it to, when you want it to, and to whom you want it to.
- Developer API. Use Datadog's Restful HTTP API to capture the information that is unique to your infrastructure, then generate and upload JSON dashboards to monitor that information.
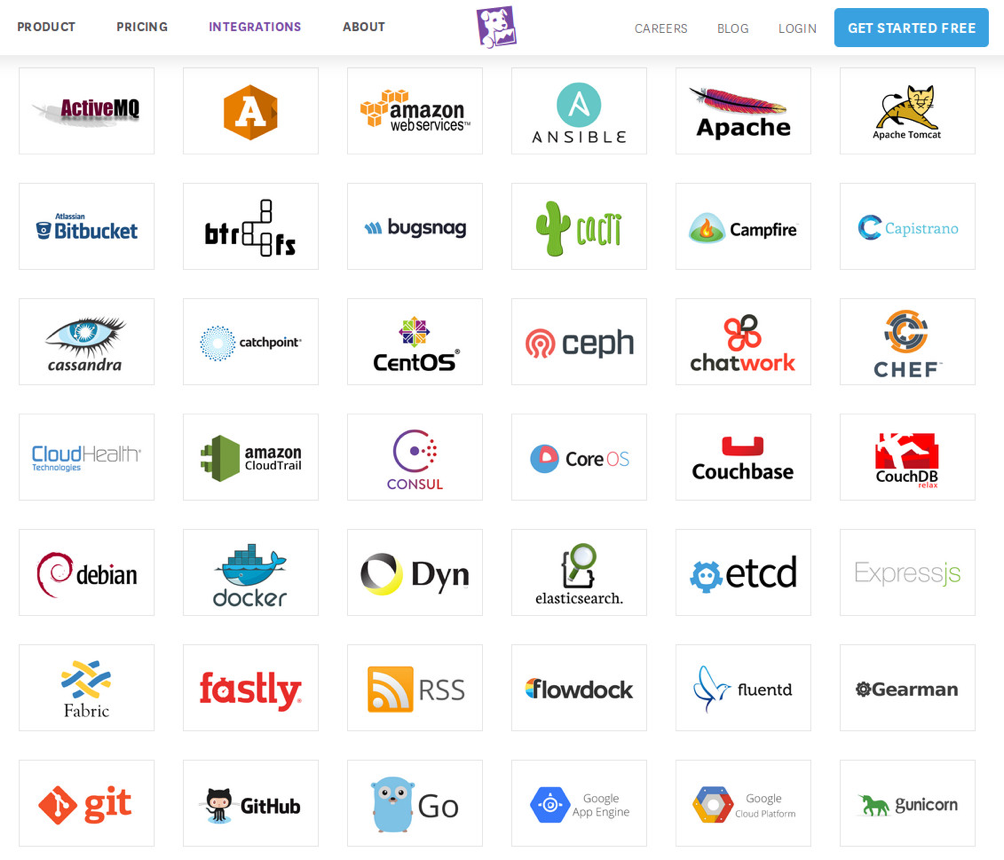
Just a few of Datadog's integrated products and services.
Integrations
To do its job, Datadog needs to talk to the products and services you use. And the easier this is for you to do, the more valuable Datadog becomes. Datadog has integrations with more than 120 products and services built right into it. Here's a look at a fraction of the Integrations page, showing some of the high-quality products they work with:
For each integration, Datadog provides a detailed instruction set so you can get up and running more easily. At the time of this review, they are working to convert all these instruction sets into a new format for consistency and ease of use. Once the integrations you use are converted to the new format, they will be structured like this:
- Overview
- Installation
- Configuration
- Validation
- Usage
- Metrics
- Compatibility
Alerts
Getting alerts when a problem occurs is crucial to keeping your infrastructure running smoothly. Datadog gives you the ability to get alerts from every level of your infrastructure. A partial list of what we're talking about includes:
- Application and System Metrics
- Up/Down Status Checks
- Service Health Alerts
- Tagged Metric Alerts
- VM and Container Alerts
- Individual and Group Host Alerts
- Threshold Alerts
- Outlier Detection
Datadog can apply lots of intelligence to these alerts too. You can tune the system to recognize acceptable failure levels, subcritical components, and mute alerts during planned downtime. Why get jolted out of bed in the middle of the night if you don't have to?
When an alert is called for, the system can deliver them through a wide range of communication and collaboration tools so you can stay in your regular workflow. You can specify who should get which alerts and when, so they are routed correctly and you aren't getting interrupted by alerts you aren't responsible for. Slack, Hipchat, PagerDuty, and ServiceNow are just a subset of the tools Datadog works with. And if a connection to your favorite tool isn't already integrated, you can use webhooks to tie it in yourself.
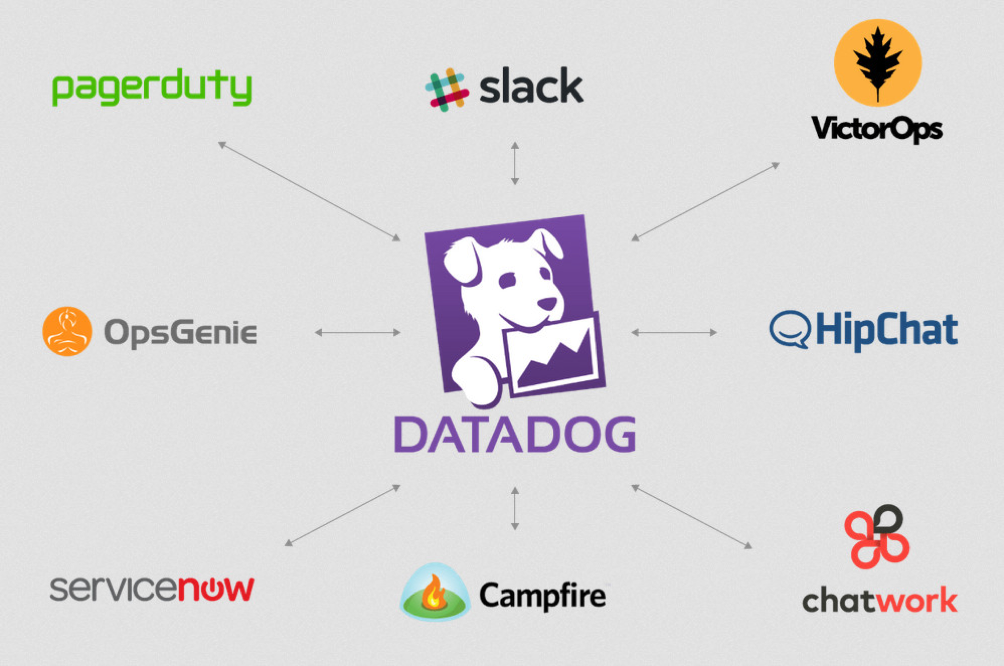
Datadog delivers Alerts through your regular workflow.
You'll like the alerts Datadog delivers too (as much as it is possible to like an alert). They are designed to give you as much context on the problem as possible. Instead of a simple, cryptic message, this system will give you a graph of the data before and after it triggered the alert. Each alert also includes a runbook. This allows whoever creates an alert to add simple diagnostic and remediation steps.
The Developer API
As mentioned before, you can use Datadog's Developer API to instrument your own infrastructure. Combined with a large selection of client libraries, the API lets you write the code you need to capture the events and metrics you care about. Important Developer API features are:
- A large selection of client libraries for easy integrations
- Server tagging and command-line querying
- Resource-oriented URLs
- Status codes and JSON returns from requests
- Restful HTTP API access
- Authenticated access using API and Application keys
Going into more detail on the workings of the API is beyond the scope of this review. If you want to get the full details, a good starting point is this API Reference Page.
Datadog Docs
The Datadog Docs page provides a large set of resources to help you get set up and running effectively. At the time of this review (August, 2016) they offered 20 Guides to various aspects of using the service. These range from topics like, "Getting Started with the Agent" to "Outlier Detection" and "Configuring Teams & Organizations with Multiple Accounts."
The Datadog Docs page also includes a nice collection of References covering a range of topics in depth. For example, the Libraries section links to dozens of Datadog-related libraries from a variety of internal and external sources. This section also includes more than 30 videos.
The Blog
Like the Datadog Docs pages, the blog contains a big batch of posts, many with detailed technical instructions for integration or monitoring issues. You can either browse the blog or do keyword searches. And once you get into an article, you will find navigation at the top of the page that can take you to additional information.
Pricing
Datadog offers a flexible, three-tiered pricing structure, with no credit card needed to get started. The tiers are Free, Pro, and Enterprise. They have the following characteristics:
- Free. The Free tier supports a maximum of 5 hosts. It includes 1 day retention of data along with custom metrics & events, but does not include alerting. Support is by discussion group only.
- Pro. The Pro tier supports up to 500 hosts. The price is $15 per month per host if billed annually, or $18 per month per host if billed monthly. It gives you 13 month retention of data, along with custom metrics, events, and alerts. Support is by email.
- Enterprise. The Enterprise tier is for organizations with 500+ hosts. It gives you a customized retention policy, custom metrics, events, and alerts. Support is by email and phone. You'll need to talk to the Datadog sales team to determine the cost of the service.
If you want to try Datadog, you begin with a 14-day free trial. You can monitor as many servers as you like during the trial period. And as with the other pricing tiers, you don't need a credit card to sign up.
Conclusion
That's our quick run through the features and capabilities of Datadog. It is easy to set up, and includes a large set (over 120 at the current time) of turn-key integrations with a huge collection of popular infrastructure components. If you want to reduce the workload required to properly monitor your infrastructure, Datadog has a lot of potential.
If Datadog looks promising to you, you're going to want to dig further. The first step is probably to look at resources like their Docs page and their list of supported integrations. Then of course it will be time for a live test of their system. They make this easy with their 14-day free trial and Free tier of service. So what are you waiting for? Set up your test installation of Datadog today.
Read more about Datadog on DiscoverCloud.
Top DiscoverCloud Experts

Deepak Chauhan
Digital Business Strategist, CEO & Founder of VOCSO Technologies
Sales and Marketing | Software Development and 20 more
View Profile

Hajra Batool
I am working as a system analyst and digital marketer in software company in pakistan.
Sales and Marketing | Customer Management and 11 more
View Profile

kriptone Digital Security
Kntrol software: Boost business efficiency with a user-friendly interface and seamless integration.
Software Development | IT and Infrastructure and 9 more
View Profile
Interested in becoming a DiscoverCloud Expert? Learn more
X
Compare Products
Select up to three two products to compare by clicking on the compare icon () of each product.
{{compareToolModel.Error}}Now comparing:
{{product.ProductName | createSubstring:25}} X
{{CommentsModel.TotalCount}} Comments
Your Comment